A national newspaper in Norway just recently traveled around Oslo to test 4g speed. They tested Telenor and Netcom with a Samsung Galaxy 4 Active using the app Ookla Speedtest.
Even if this is not an extensive test, I think this illustrate the connectivity dimension quite well. Connectivity on mobile devices is dramatically different from how we think (or not think) about it for desk- or laptop scenarios.
VG (the newspaper) only published this in their paper edition (an edition of vg.no printed on paper to be read in a book-like manner), so I publish it here:
| Netcom | Telenor | ||
| Place | Location | Mbps down | Mbps down |
| Location 1 | Outside |
36,33 |
15,18 |
| Location 1 | Outside |
36,39 |
18,69 |
| Location 2 | Outside |
24,76 |
18,17 |
| Location 3 | Car moving |
0,36 |
6,18 |
| Location 4 | Car moving |
9,15 |
14,99 |
| Location 5 | Outside |
42,49 |
13,17 |
| Location 6 | Outside |
30,55 |
19,65 |
| Location 7 | Car not moving |
38,79 |
19,71 |
| Location 8 | Outside |
24,01 |
19,96 |
| Location 9 | Saloon |
7,86 |
19,07 |
| Location 9 | Saloon |
11,78 |
8,86 |
| Location 9 | In car lower deck |
0 |
2,77 |
| Location 10 | Car moving |
0 |
0,15 |
| Location 11 | Car moving |
21,5 |
1,47 |
| Location 12 | Car moving |
44,09 |
18,85 |
| Location 12 | Car moving |
10,49 |
9,16 |
| Location 13 | Outside |
10,61 |
19,65 |
| Location 13 | Outside |
12,34 |
20,16 |
| Location 14 | Car moving |
16,29 |
16,5 |
| Location 15 | Outside |
2,53 |
20,04 |
| Location 16 | Train moving |
13,57 |
9,59 |
| Location 17 | Underground |
1,29 |
0,1 |
| Avg |
17,96272727 |
13,27590909 |
Here is also a chart displaying bandwidth for the different locations:
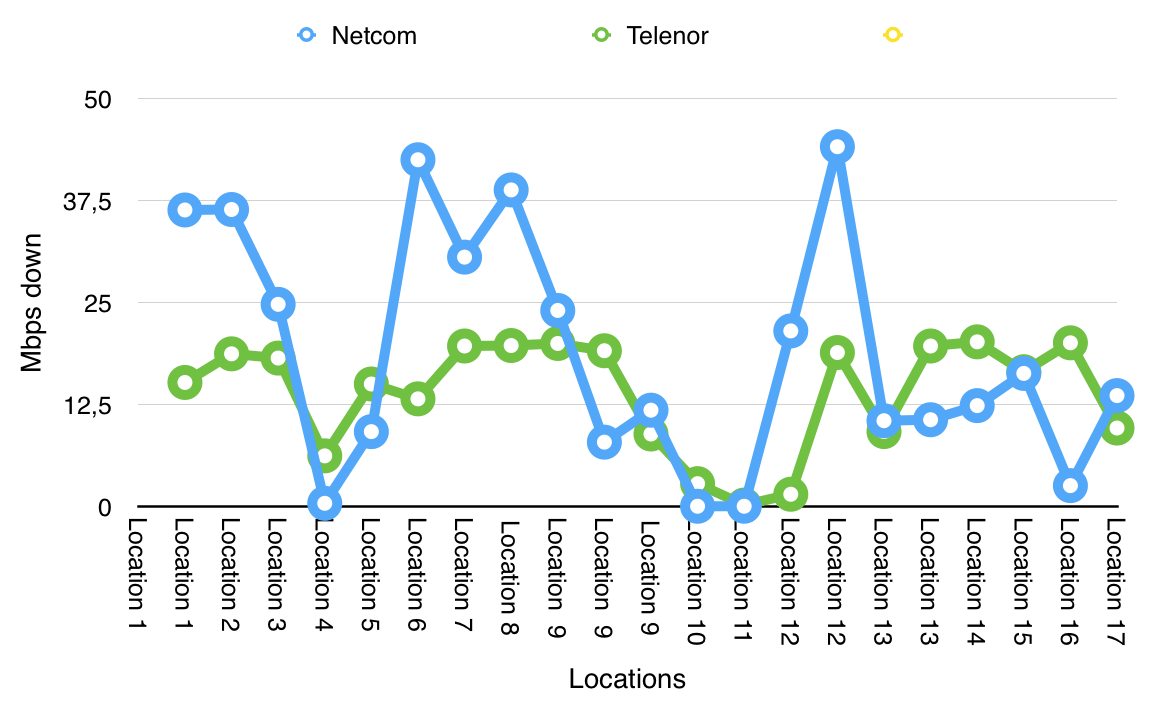
Changing bandwidth different locations
Also worth noticing that the actual bandwidth is capped by the type of subscription you have.
#FYI